Visual real-time reports on your engagement outcomes
Reporting
Comprehensive and flexible reporting tools. Download reports, charts and data with one click.

In-depth insights | Greater understanding
Reporting on your engagement outcomes
With our reporting dashboards (launching soon) and customisable pre-built reports, you can quickly see how your engagement is going and drill down into in-depth data on your projects, stakeholders, or communications.

Your Reporting Control Centre
Every time you log into your engagement platform, instantly see stats on how many new or total registered users you have, top active projects, the level of engagement amongst stakeholders, how your communication and team are performing and much more!
See the breakdown of data across six key areas (launching soon):
- Individual Projects
- All projects
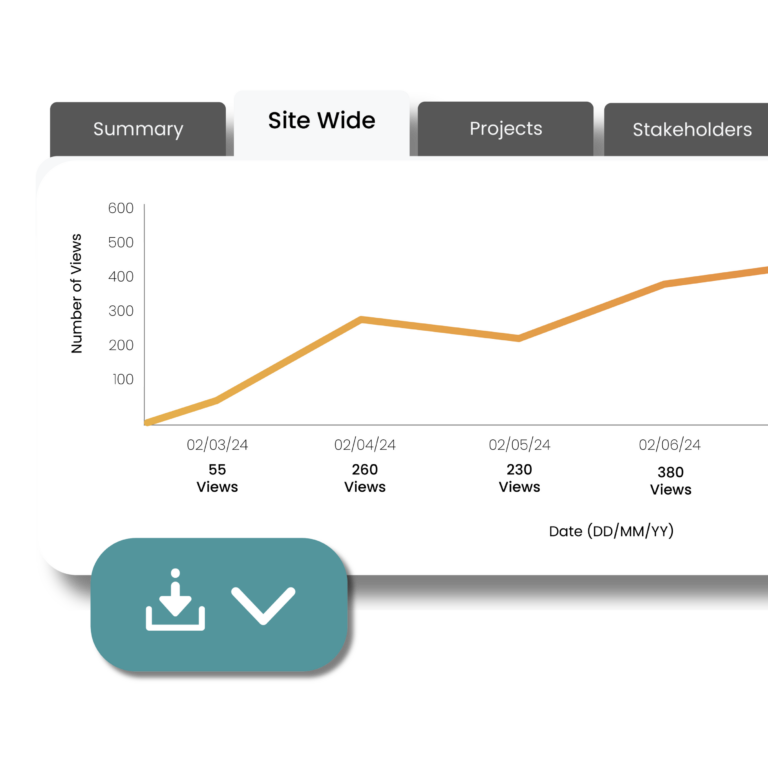
- Site-Wide
- Stakeholders
- Team Productivity
- Insights – Over 20 pre-built, customisable reports (available now)
Insights Reporting
In addition to our 6 Reporting Dashboards (launching soon), our Insights Reports contain over 20 key reporting tools. Customisable so you can define dates, segments or change colours of your downloadable charts and graphs.
Projects Activity Report
Users Segmentation
Top Influencers
Offline Users
Feedback Text Cross Analysis
Segment v Segment
Compare Project Sentiment
Users - Household Composition
Registered Users by Suburb
Tag v Tag Analysis
Engagement Level by Project
Top Active Users
Projects by Status
Generate phrase cloud
Registered Users by Age & Gender
Feedback Analysis - Key Topics and Tags
Workflow Tasks
Newsletters
Site Activity Report
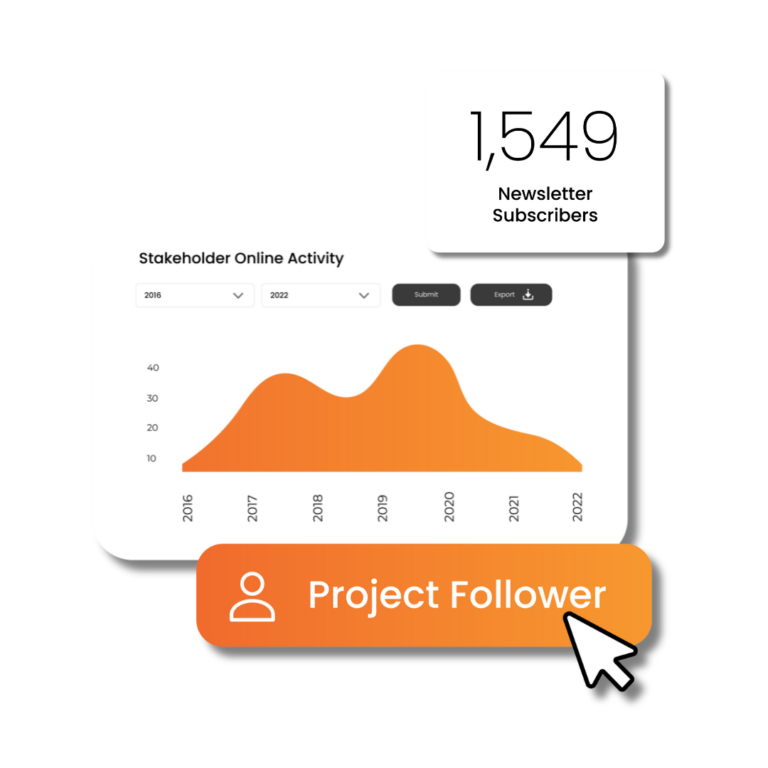
Project Reporting
Select a project (and a date range if needed) and visually see how your project is performing – how many contributions, followers, the level of engagement, ideas posted, a heat map of project stakeholder locations and themes in the feedback.
Visually see all offline and online activity across one or all of your projects.
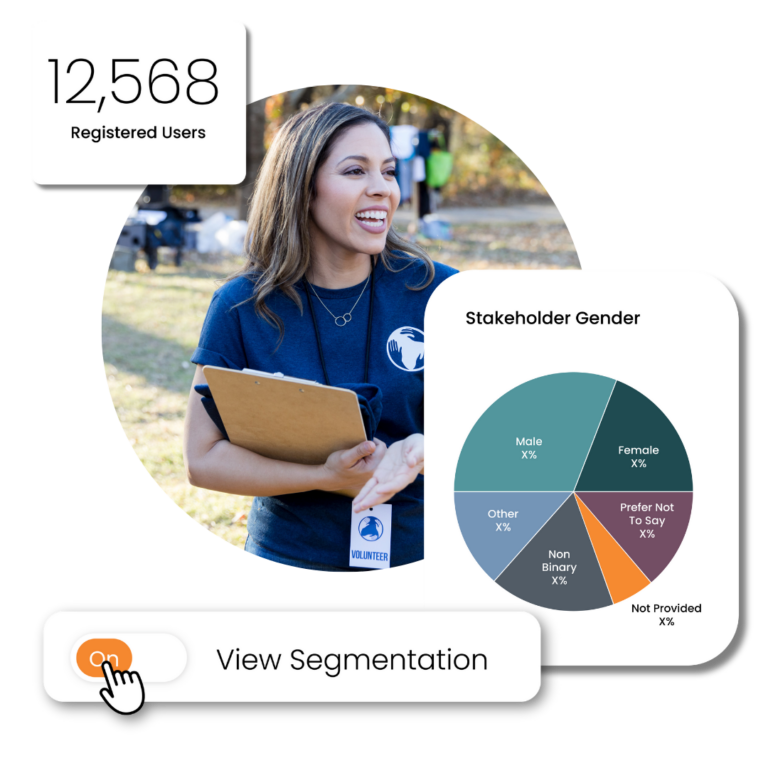
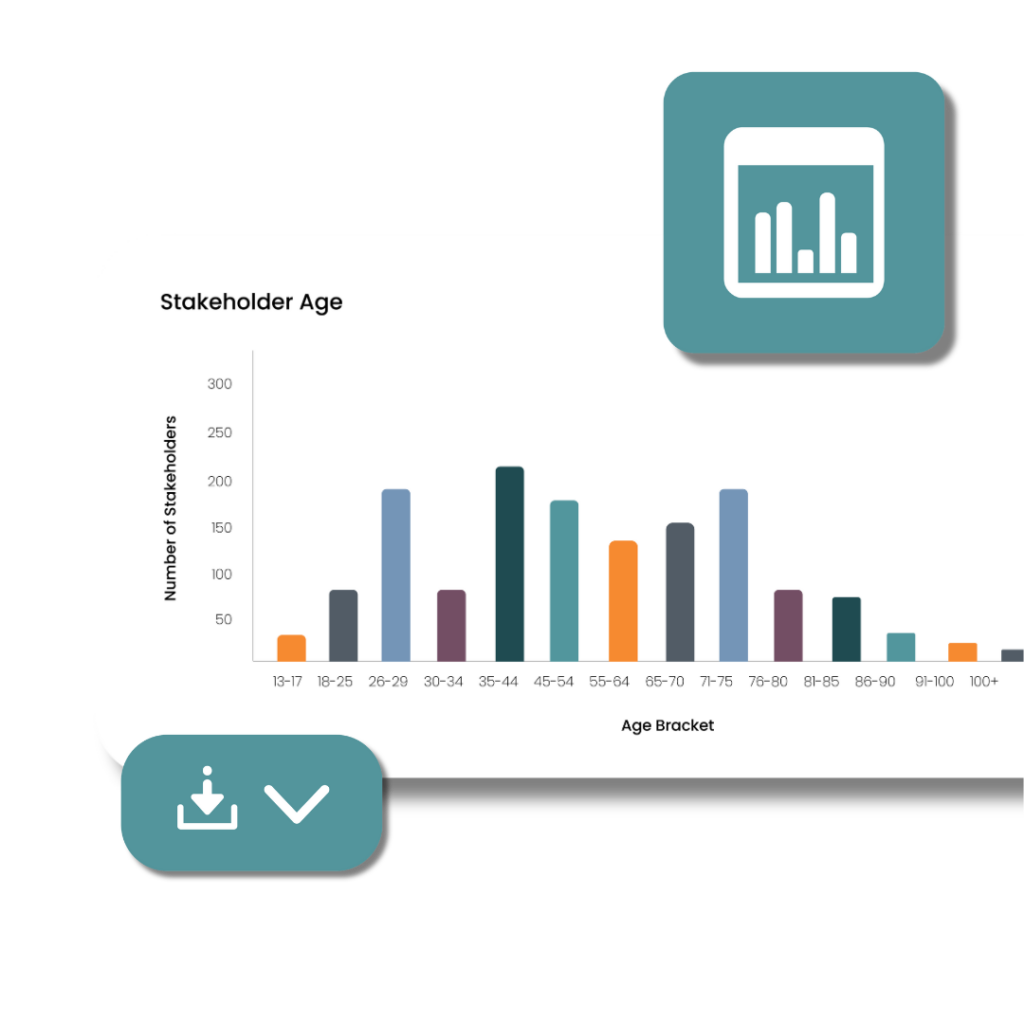
Stakeholder Reporting
Get to know your stakeholders with extensive, detailed reporting options.
Productivity Reporting
Keep track of your team activity across the software including time on site, actions taken, and tasks completed.
Do more with your reporting
There are hundreds of ways to slice and dice your data. Use our reporting dashboards (launching soon) for pre-built visual reports or filter, segment, and search to set your parameters. See sentiment, tag feedback or understand team member activity.
frequently asked questions
Reporting
How many reporting tools does Engagement Hub have in total?
We started counting and once we’d reached over 600 ways you could report using the software – we stopped counting! The possibilities for reporting are endless.
Use as much or as little of the reporting features as you need. Download a simple project report with one click to see all activity on your project or drill down into the demographics or contribution data.
How do your reporting tools compare to other software?
Simply, Engagement Hub offers more. We have the most comprehensive online engagement reporting, which allows our clients across all sectors to truly understand their engagement outcomes and have great insights into their stakeholders.
Contact us for a complete comparison of all the features of our software with other engagement software in the market.
What reports can I download?
Everything is downloadable, many in various formats.
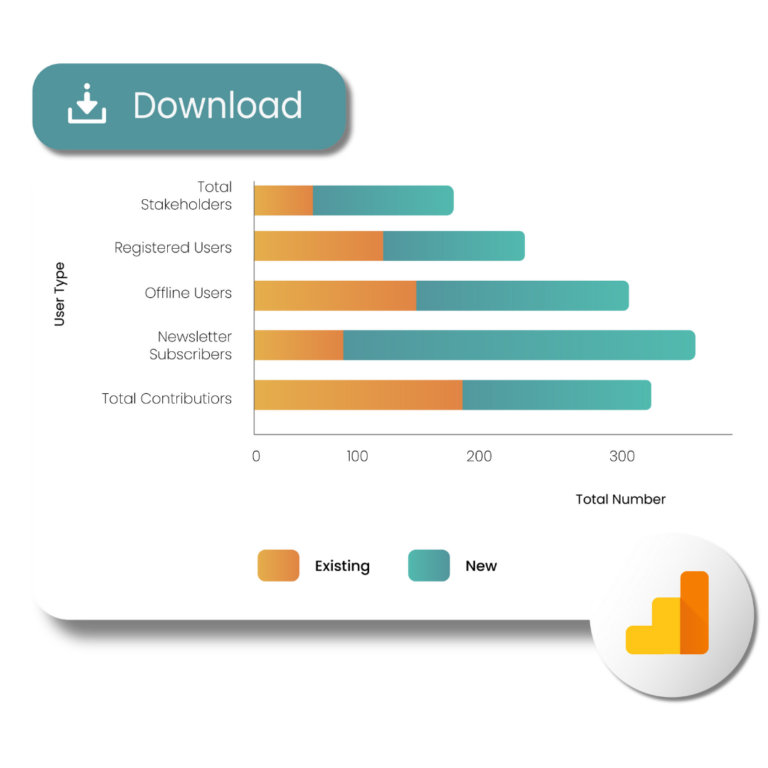
You can download:
an editable project report in Word so you can cut and paste into your corporate reporting
instant pdf report downloads on all projects, individual projects, stakeholders, productivity and site-wide activity
every bar chart, graph or table can be downloaded as an image (various formats) or CSV file
What training do you offer to learn how to use these tools?
During your site implementation, you will be offered training sessions with one of our highly knowledgeable engagement specialists – one of which focuses purely on reporting. This training is completely tailored to you and you can invite your whole team.
Following training, you can view articles, videos and download ‘how to’ guides in our Online Resource Centre, attend our regular client webinars, submit a ticket to our technical help desk or get support from one of our team.
We are here to make sure you maximise the benefits of the software.
Does your reporting integrate with other systems and software?
Our clients operate a huge variety of different software applications and internal systems. We therefore don’t integrate directly with anything other than Google Analytics (GA4) which provides acquisition data and allows you to see the whole journey of your users.
As all our data is downloadable, our clients download reports, charts and data and upload and insert into corporate systems and presentations.